Systems Integration and Display
Last updated
Last updated
The System Integration and Display system in the BELL 505 is facilitated by the Garmin G1000H NXi Integrated Avionics System (IAS). This comprehensive system consists of a configurable combination of primary flight, navigation, engine instrument, crew alerting displays, and supporting systems.
The BELL 505 G1000H NXi system consists of the following Garmin Line Replaceable Units (LRUs).
Garmin Display Unit (GDU): Each GDU provides a 10-inch high-resolution LED-backlit display. The right-side unit is designated as the Primary Flight Display (PFD) and the left-side unit is designated as the Multi-function Display (MFD). The GDUs provide primary display and control capabilities for the G1000H NXi system.
Integrated Avionics Unit (GIA): The GIA acts as a central processor, integrating multiple avionics systems, including communication, navigation, surveillance, flight management, hazard avoidance, and other features.
Audio Panel (GMA): The audio panel handles communication and audio management for the aircraft's avionics and communication systems.
Engine and Airframe Interface Unit (GEA): The GEA processes data related to the airframe and engine systems, providing essential information to the indicating and recording system.
Transponder (GTX): The transponder provides aircraft identification and altitude information to air traffic control systems. It is equipped with extended squitter and ADS-B "Out" capabilities for enhanced surveillance and compliance with ADS-B requirements.
Air Data / Attitude Heading Reference System (ADAHRS): The ADAHRS provides accurate and reliable flight environment data and attitude and direction data for the integrated avionics system.
Magnetometer (GMU): The GMU serves as a magnetic heading reference for the navigation system.
Outside Air Temperature (OAT) Probe: The OAT probe provides outside air temperature to the ADAHRS.
Radar Altimeter (GRA): The system offers an optional kit for a radar altimeter, which provides altitude information based on radar signals to enhance situational awareness during low-level flight operations.
Each GDU can operate as a Primary Flight Display (PFD) or Multi-Function Display (MFD) and can operate in reversionary mode. The PFD provides flight instruments and critical flight data, while the MFD offers multi-functional capabilities. In addition to displaying all required flight, powerplant and system information, the displays allow for the tuning of communication and navigation frequencies, flight planning interfaces, barometric correction inputs, cursor control, map range selection and panning, and context-sensitive softkeys.
The PFD presents essential flight information to the pilot, including airspeed, attitude, altimeter, vertical speed, heading, and slip/skid indicators, as well as ground speed, altitude select, and baro-correction settings. Additionally, it offers selectable aircraft symbol formats, synthetic vision technology (SVT) display presentation, VHF COM 1 tuning and controls, VHF NAV 1 tuning and controls, course and heading selection, Course Deviation Indicator (CDI), bearing pointers, and information windows.
The PFD also includes Navigation Source, Vertical Deviation (VDI), Glideslope, and Glidepath Indicators, Minimum Descent Altitude (MDA) and Decision Height (DH) settings, Turn rate indicator, and inset map. It provides access to Crew Alerting System (CAS), Power Situation Indicator (PSI) displaying Torque (Q), MGT, NG, NP, and NR indications, display backlighting adjustment control, and various avionics upgrade features like Synthetic Vision Technology (SVT), Helicopter Terrain Avoidance Warning System (HTAWS), and Traffic Advisory System (TAS).
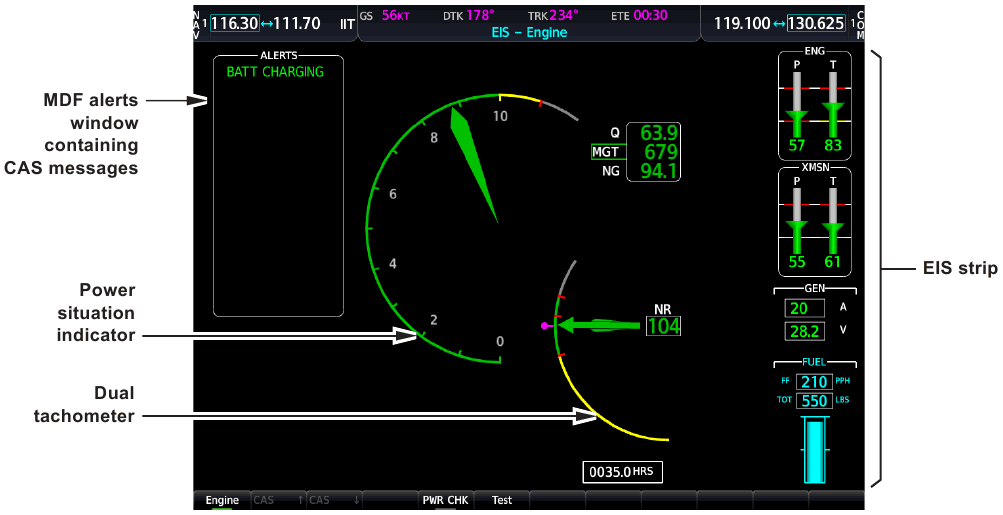
The MFD offers a moving map display with user-selectable overlays, range selection, zoom, declutter, bearing/distance capabilities, VHF COM 1 tuning and controls, VHF NAV 1 tuning and controls, course and heading selection, altitude select, and baro-correction settings. It has a dedicated Engine page that displays enlarged Power Situation Indicator (PSI), expanded CAS window, and Engine Indication Strip (EIS) on the right side of the MFD.
The MFD also supports Flight Management System (FMS) capabilities, including flight planning, graphical flight planning, storage of up to 100 flight plans, lateral and vertical direct-to features, support for user-defined waypoints, published SIDs, STARS, and holding patterns. It features navigation capabilities such as Departure, Terminal, Enroute, Oceanic, RNAV Approach, Missed Approach, and Auto-tuning VHF navaids. The MFD provides information on nearest airports, intersections, NDBs, VORs, VRPs, User Waypoints, Frequencies, and Airspaces.
Additionally, it includes System Synoptic pages for exceedances, power assurance, weight & balance, auxiliary information like trip planning, utility, GPS Status, System Setup, Maintenance Logs, System Status, OEM Diagnostics, Exceedances, ADS-B Status, and Databases. The MFD also supports additional optional features like electronic charts, SafeTaxi diagrams, and weather data link (FIS-B) when equipped with the GTX 345R Transponder.
Multiple data paths ensure system redundancy for data input to the PFD and MFD. The Integrated Avionics Unit (GIA) provides CAS messages and parameter indications, while the Air Data / Attitude Heading Reference System (ADAHRS) directly provides air data and attitude heading data. Engine data, including Q, MGT, NG, Np, engine oil temperature, and pressure, is provided by Engine Control Unit (ECU) channels A and B.
The displays prioritize data inputs from the ECU channels, ensuring seamless operation based on which channel is in control. The displays also have alternate data paths to the GIA for redundancy. In case of failure, the remaining operable display receives engine data from the GIA via a High-Speed Data Bus (HSDB).
Accessing the Primary Flight Display (PFD) and Multifunction Display (MFD) functionality is made effortless through an array of intuitive controls and pages.
The system controls, strategically located on the PFD and MFD bezels, have been meticulously designed to simplify operation, minimize workload, and provide quick access to a wide range of sophisticated features.
Softkeys: Positioned along the bottom of the displays, selection softkeys provide access to a range of functions. They facilitate simple on/off states, option selection, and navigation to additional softkeys. After 45 seconds of inactivity, softkeys automatically revert to the previous level, and labels for disabled functions appear subdued.
MENU Key: When pressed, the context-sensitive MENU key displays a list of options tailored to the current window or page. This feature enables users to access additional features or make relevant settings changes. The system does not have an all-encompassing menu, but some menus provide access to submenus for viewing, editing, selecting, and reviewing options. When there are no options for the selected window/page, the display shows "No Options."
FMS Knob: The FMS Knob, positioned near the lower right corner of each display, serves as the primary control for accessing MFD functionality. Its actions are as follows:
Turn the large FMS knob to change page groups.
Turn the small FMS knob to change pages within a group.
Press the small FMS knob directly in to activate the cursor for a page.
Turn the large FMS knob to cycle the cursor through different data fields.
Turn the small FMS knob to change the contents of a highlighted data field, bringing up an options menu or allowing data entry
Press the small FMS knob to cancel. Pressing the small FMS knob again turns the cursor off
ENT Key: Pressing the ENT key confirms a selection.
CLR Key: The CLR key cancels a selection or turns off the cursor.
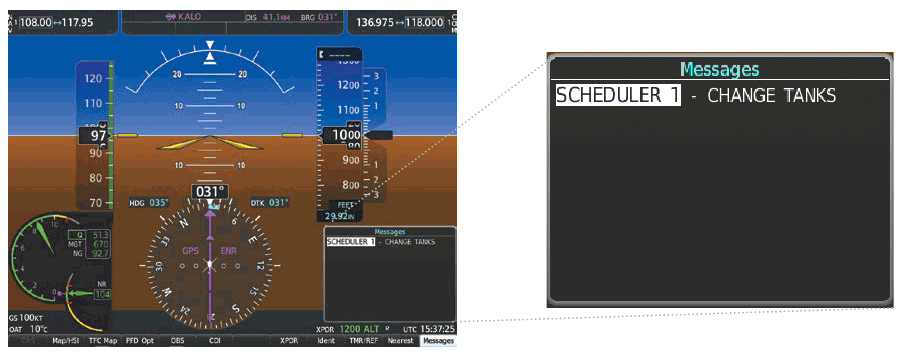
The PFD softkeys provide control over the PFD display and some flight management functions; including GPS, NAV, terrain, and traffic. Each softkey sublevel has a Back Softkey, which can be pressed to return to the previous level. If new messages remain after acknowledgment, the Messages softkey will show Message in black text on a white background. The Messages Softkey is visible at all softkey levels. For the top level softkeys and the transponder (XPDR) levels, the Ident softkey remains visible.
The MFD softkeys provide control over the MFD display and flight management functions, including GPS, NAV, terrain, and traffic. Various softkey functions are available on the MFD depending on the page group and page selected.
Information on the MFD is presented on pages grouped according to function. The page group and active page title are displayed in the upper center of the screen, below the Navigation Status Box. In the bottom right corner of the screen, a page group window is displayed by turning either FMS Knob. The page group tabs are displayed along the bottom of the window. The page titles are displayed in a list above the page group tabs. The current page group and current page within the group are shown in cyan. For some of these pages, the active title of the page changes while the page name in the list remains the same.
The main page groups are navigated using the FMS Knob; specific pages within each group can vary depending on the configuration of optional equipment.
There are several pages which may be selected by pressing the appropriate softkey at the bottom of the page (or from the page menu). In this case, the active page title will change when a different page softkey is selected, but the page will remain the same.
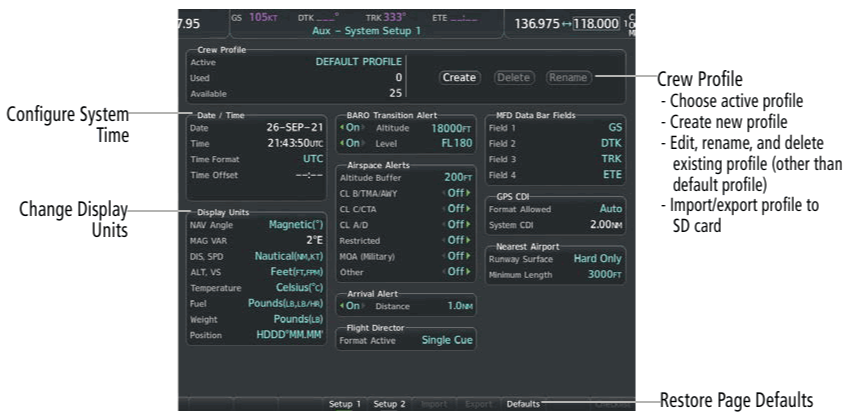
System settings are managed from the MFD Aux - System Setup pages. Fields shown in cyan text may be edited. Managing crew profiles, system time format, display units, page navigation, and audio voice format settings are discussed in this section. sections.
Time Format (local or UTC)
Display (measurement) Units
BARO Transition Alert (see the Flight Instruments Section)
Airspace Alerts (see the Flight Management Section)
Arrival Alert (see the Flight Management Section)
Flight Director (see the Flight Instruments Section and the AFCS Section)
MFD Data Bar (i.e., Navigation Status Box) Fields (see the Flight Management Section)
GPS CDI (see the Flight Instruments Section)
Nearest Airport (see the Flight Management Section)
Touchdown Callouts
COM Configuration (see the Audio & CNS Section)
Audio
If desired, the default system settings may be restored at any time.
The MFD Aux - System Status Page displays the status, serial number, and software version number for each detected LRU. Information about system databases is also displayed.
The LRU and ARFRM softkeys on the System Status page select the associated LRU Information list or Airframe list. The FMS knob can be used to scroll through information within the selected window.
Status: A green check mark is displayed for a properly operating LRU. A red X is displayed when an internal LRU fault is detected and the LRU has taken itself off line, or if the MFD cannot communicate with the LRU.
Serial Number: Each LRU serial number is displayed. Functions such as COM are contained within an LRU. Therefore, serial numbers are not shown for these.
Currently loaded software version
Pressing the MFD DB softkey places the cursor in the database window. The FMS knob can be used to scroll through the MFD database information. Pressing the softkey again will change the softkey label to PFD DB. PFD database information is now displayed in the database window. Pressing the softkey a third time will change the softkey label back to MFD DB. MFD database information is again displayed in the database window.
Garmin Line Replaceable Units (LRUs) carry out Built-In Test (BIT) and performance checks on a full time basis. They do not require a special request to run the BIT cycle. All LRUs report health and diagnostic information to the display in real time.
The Primary Flight Display (PFD) acts as the central location for tracking all LRU health status. Any abnormal event reported by a system LRU is presented to the operator using a System Message displayed on the PFD.
The Flight Instrument System provides enhanced situational awareness through an easily readable Primary Flight Display (PFD), which prominently features essential flight parameters such as horizon, airspeed, attitude, altitude, vertical speed, and course deviation information. Additionally, the system includes engine, navigation, and communication data, while optional kits offer terrain, traffic, and weather information directly on the PFD.
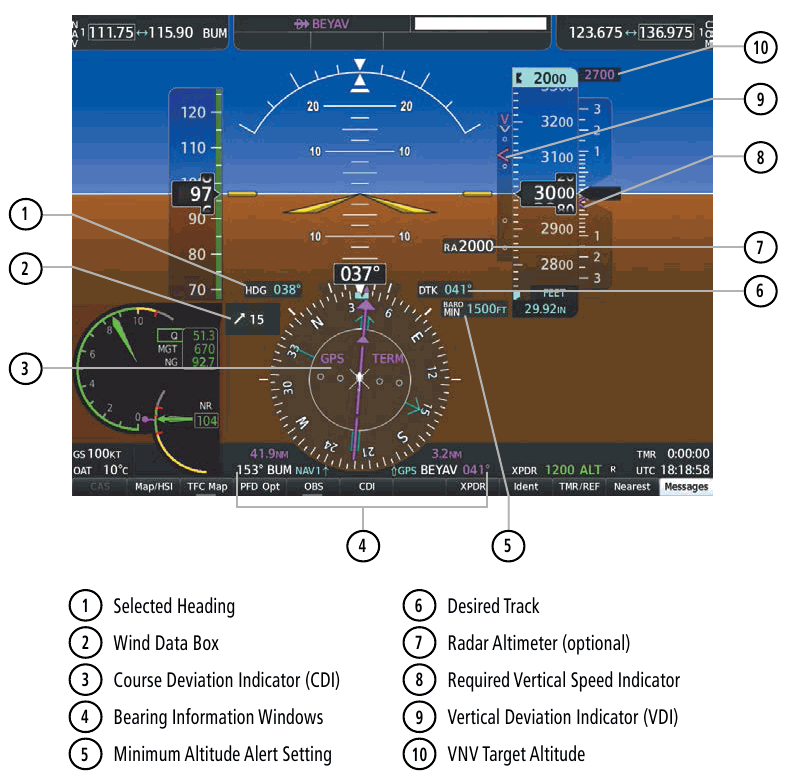
The PFD presents the following flight instruments and supplementary flight data:
Airspeed Indicator: Displays indicated airspeed, airspeed awareness ranges, and trend vector for precise speed monitoring.
Attitude Indicator: Shows aircraft attitude and slip/skid indication, aiding in maintaining proper orientation during flight.
Altimeter: Provides barometric setting, trend vector, and reference altitude, ensuring accurate altitude awareness.
Vertical Speed Indicator (VSI): Indicates the rate of climb or descent for precise vertical navigation control.
Vertical Deviation, Glideslope, and Glidepath Indicators: Assists with precision vertical navigation during approach and landing.
Vertical Navigation (VNV) Indications: Supports vertical flight path guidance for improved navigation during climb and descent.
Horizontal Situation Indicator (HSI): Integrates critical navigation information, including turn rate indicator, Course Deviation Indicator (CDI), bearing pointers, information windows, and navigation sources.
Outside Air Temperature (OAT): Provides ambient temperature information for flight planning and system monitoring.
Wind Data: Presents real-time wind information to aid in flight planning and optimize aircraft performance.
Engine Data: Includes Power Situation Indicator (PSI) and dual tachometer, offering comprehensive engine performance monitoring.
Optional Kit:
Radar Altimeter (optional kit): Provides altitude information with respect to terrain for enhanced safety during low-altitude operations.
Transponder Mode, Code, and Ident/Reply: Displays transponder mode, assigned code, and ident/reply status to ensure compliance with air traffic control requirements.
The flight instruments receive data inputs from the following primary sources:
Air Data/Attitude Heading Reference System (ADAHRS): Provides crucial air data and attitude heading information to ensure accurate flight parameter displays.
Integrated Avionics Unit (GIA): Delivers essential data for engine, navigation, and communication systems, supporting the PFDs comprehensive display capabilities.
The Engine Indication System (EIS) is a critical component providing indications for aircraft performance. It includes the following:
Power Situation Indicator (PSI) and dual tachometer display, offering essential information about engine and RPM status.
EIS strip on the Multi-Function Display (MFD), further provides comprehensive data on engine, transmission, electrical, and fuel systems.
Additionally, an enlarged version of the PSI and dual tachometer can be accessed through the Engine page of the MFD. In the event of a PFD or MFD failure, the EIS ensures continued awareness with a composite display mode, presenting the PSI, dual tachometer, and a condensed EIS strip on the remaining functioning display.
The Power Situation Indicator (PSI) is a comprehensive display that allows effective management of engine power and its impact on the rotor system. It presents crucial data on engine parameters, including:
Engine Torque (Q)
Measured Gas Temperature (MGT)
Gas Producer Turbine speed (NG)
Power Turbine speed (NP)
Rotor speed (NR)
The PSI consists of three sections:
Power indicator section
Power parameters digital readout section
Dual tachometer presentation section
Moreover, it provides additional information such as:
Five-minute takeoff timer
Engine data source annunciation
Data source inputs with exceedance monitoring
The PSI's primary advantage for pilots is its ability to consolidate essential information into a single indicator, streamlining power management and enhancing situational awareness.
The power indicator section of the Power Situation Indicator (PSI) shows essential information about engine power and limits. It uses a single round-dial gauge and displays data for the following parameters:
Engine torque (Q)
Measured Gas Temperature (MGT)
Engine gas producer turbine speed (NG)
The purpose of the power indicator section of the PSI gauge is to indicate how much power is available between Q, MGT, NG, before reaching the Maximum Continuous Power (MCP) limit and maintain a display of margins to any other limits. Margins are displayed in terms of power indicator needle travel rather than actual parameter values.
The power indicator needle indicates against a normalized arc scale where 10 is the MCP limit, 5 represents flat pitch with the THROTTLE switch in the FLY detent, and 3 indicates ground idle power with the THROTTLE switch at IDLE on a standard day. This means that for standard operating conditions, the power indicator needle position and rate of movement is about the same for similar power settings for all three parameters (Q, MGT, and NG).
When operating within the green range, the power indicator needle corresponds to the parameter closest to the MCP point. Beyond the MCP point, the power indicator needle indicates the parameter farthest from the MCP point. For a given set of conditions, the parameter (Q, MGT, or NG ) that ends up being responsible for establishing the position of the power indicator needle is referred to as the controlling parameter. The angular distance between the power indicator needle and the 10 position (MCP limit) can be considered an indication of the available power margin.
A red radial tick mark represents the engine's operating limit, and a yellow arc indicates the available five-minute takeoff power. The arc beyond this appears gray, but changes to red if the power indicator needle moves beyond the red tick mark indicating a power limit has been exceeded.
The size of the yellow arc and the position of the red radial tick mark can vary to indicate the margin available until any parameter reaches its red line limit. The parameter determining red line position may not necessarily be the same as the controlling parameter. In this case, the red line may change position as power is demanded from the engine or as operating conditions change.
In addition, NG limits adjusted for OAT and pressure altitude are presented on the PSI. Based on this, the NG limits presented on the PSI can be lower than the limitation values provided in the Flight Manual due to the actual OAT and pressure altitude conditions.
The power parameter digital readouts display the current values of the engine parameters (Q, MGT, or NG) shown on the power indicator section. The digital readouts show:
Engine torque (Q) as a percentage of the transmission torque limit
Measured Gas Temperature (MGT) in degrees Celsius (°C)
Gas producer turbine speed (NG) as a percentage
A colored box around the parameter legend indicates which parameter is controlling the position of the power indicator needle in the power indicator section.
The digital readouts are color-coded to indicate their operating ranges. The color of the power indicator needle matches the color of the controlling parameter digital readout. Green indicates normal range (below MCP), yellow indicates the five-minute takeoff zone, and red (white digits on a red background) indicates operating above the limit. The controlling parameter indicator box also matches the color of the parameter range and the power indicator needle. If the engine is in an engine-out condition while the helicopter is airborne, the associated digital readouts are displayed in grey.
The yellow arc zone in the power indicator section indicates the five-minute time-limited operating zone for engine torque (Q), Measured Gas Temperature (MGT), and Gas producer turbine speed (NG) during takeoff. If the power indicator needle enters this yellow arc zone when Q, MGT, or NG is the controlling parameter, a yellow five-minute Take-Off (T/O) timer appears inside the power indicator arc. The timer counts down in minutes and seconds, and when it has 30 seconds remaining, it flashes, and an impending exceedance audio alert tone "ping, ping" activates. If the timer reaches zero, it remains at zero, and the display turns red. In such an event, an exceedance is logged in the display unit memory and the Engine Control Unit (ECU) when applicable. Additionally, when operating in the takeoff power range above 80 KIAS or placarded VNE, a VNE audio alert is also provided, whichever is less.
The Power Situation Indicator (PSI) provides information about engine torque (Q) in percentage.
The torque parameter data for the Primary Flight Display (PFD) and Multi Function Display (MFD) PSI indication is transmitted through the ARINC-429 bus connection from the Engine Control Unit (ECU) channel in control (either channel A or B). If the ECU channel in control is unavailable, the displays will receive data from the other ECU channel either directly from the ECU or alternatively via the Integrated Avionics Unit (GIA). In the event that the channel A or B torque signal to the Integrated Avionics System (IAS) is lost, this will display the ECU DATA or ECU MAINT CAS message. Maintenance action will be required.
The PSI displays Q values based on Bell transmission input limits, as they are reached before the engine limits. The 100% Q torque indication represents 475 SHP (428 FT-LBS) at the input to the transmission, which is the maximum power allowed for takeoff. The 90% Q torque indication represents 428 SHP, which is the continuous power limit at the transmission input. The range between 90% Q (428 SHP) and 100% Q (475 SHP) represents the five-minute takeoff power limit.
In case of a Bell% torque exceedance, the Integrated Avionics System (IAS) will activate the Q EXCEED CAS message and record torque exceedance values based on Bell% torque values. The "Q EXCEED CAS" message will remain displayed during the exceedance, and it will disappear when Q is reduced to 90%. A summary of Bell percentage torque exceedances will be available on the MFD's Aux - Exceedances page, including date/time stamp, peak value, and duration of each occurrence. The information will remain on the Aux - Exceedances page as long as the exceedance data remains in the Non-Volatile Memory (NVM).
If an ECU recorded torque exceedance event occurs, in relation to engine specific Q exceedance limits, the ECU will activate the ECU MAINT CAS message and record torque exceedances. Engine Q exceedance monitoring is done by ECU channel A, and exceedance annunciation and recording are based solely on data from this channel. Engine Q exceedance information may also be referenced on the Aux - OEM Diagnostics - Supplier Systems - ECU - Maintenance pages and in the Maintenance Logs - Exceedances folder.
Relationship Between Torque Data
Bell and Safran Helicopter Engines use different values to represent power limits. For example, the 100% Q Bell transmission input limit for takeoff is 475 SHP (428 FT-LBS), while the 100% Q ARRIUS 2R engine output limit for takeoff is 492 SHP (600 Nm). However, all Q values displayed on the Power Situation Indicator (PSI) reflect Bell transmission input values and limits.
To convert between Bell and Safran Helicopter Engines values, the following conversion factors are provided:
To convert from FT-LBS to Nm, multiply FT-LBS by 1.3558.
To convert from Nm to FT-LBS, multiply Nm by 0.7375.
To convert FT-LBS to Bell percentage Q, divide FT-LBS by 4.277.
To convert FT-LBS to Engines percentage Q, divide FT-LBS by 4.425.
To convert FT-LBS to SHP, multiply FT-LBS by 1.1109.
To convert Bell percentage Q to FT-LBS, multiply Bell percentage Q by 4.277.
To convert Engines percentage Q to FT-LBS, multiply Engines percentage Q by 4.425.
To convert Nm to Bell percentage Q, multiply Nm by 0.7375 and then divide the result by 4.277.
To convert Nm to Engines percentage Q, multiply Nm by 0.7375 and then divide the result by 4.425.
The engine Measured Gas Temperature (MGT) indication on the Power Situation Indicator (PSI) displays MGT in degrees Celsius (°C).
The MGT parameter input to the Primary Flight Display (PFD) and Multi Function Display (MFD) PSI indication is provided by the Engine Control Unit (ECU) channel in charge (channel A or channel B) through its ARINC-429 bus connection. If the controlling ECU channel is not available, the displays will receive data from the other ECU channel, either directly from the ECU or via the Integrated Avionics Unit (GIA). If the MGT signal from ECU channel A or B MGT signal to the Integrated Avionics System (IAS) is lost, the display will show the ECU DATA or ECU MAINT CAS message, and maintenance action will be required.
MGT exceedance monitoring is performed only by ECU channel A. Therefore, exceedance annunciation and recording are solely based on data from ECU channel A. The ECU and IAS will record exceedances based on data from ECU channel A. A summary of the exceedances will be displayed on the "Aux - Exceedances'' page of the MFD, providing a date/time stamp, parameter, peak value, and duration of each occurrence. The information will remain on the "Aux - Exceedances'' page as long as the exceedance data is stored in the Non-Volatile Memory (NVM). Exceedance information may also be referenced on the Aux - OEM Diagnostics > Supplier Systems > ECU - Maintenance pages and in the Maintenance Logs - Exceedances folder.
If an MGT exceedance occurs during start or normal operations, the MGT EXCEED CAS message will display. The MGT EXCEED CAS message will extinguish as follows:
During start when the MGT is reduced below 800°C
During normal operations when the MGT is reduced below 817°C
Following an MGT exceedance, the ECU MAINT CAS message will be displayed, and maintenance action will be required.
The engine gas producer (NG) indication on the Power Situation Indicator (PSI) displays NG speed as a percentage of rated RPM.
The NG parameter input to the Primary Flight Display (PFD) and Multi Function Display (MFD) PSI indication is provided by the Engine Control Unit (ECU) channel in charge (channel A or channel B) through its ARINC-429 bus connection. If the controlling ECU channel is not available, the displays will receive data from the other ECU channel, either directly from the ECU or via the Integrated Avionics Unit (GIA). If the NG signal from ECU channel A or B to the Integrated Avionics System (IAS) is lost, the display will show the ECU DATA or ECU MAINT CAS message.
NG exceedance monitoring is performed only by ECU channel A. Therefore, exceedance annunciation and recording are solely based on data from ECU channel A. The IAS will record exceedances based on data from ECU channel A. A summary of the exceedances will be displayed on the "Aux - Exceedances" page of the MFD, providing a date/time stamp, parameter, peak value, and duration of each occurrence. The information will remain on the "Aux - Exceedances" page as long as the exceedance data is stored in the Non-Volatile Memory (NVM). Exceedance information may also be referenced on the Aux - OEM Diagnostics - Supplier Systems - ECU - Maintenance pages and in the Maintenance Logs - Exceedances folder.
During an exceedance, the NG EXCEED CAS message will display. The NG EXCEED CAS message will extinguish when the NG is reduced below 99.8%.
Following an NG exceedance, the ECU MAINT CAS message will be displayed, and maintenance action will be required.
The dual tachometer section of the Power Situation Indicator (PSI) represents the power turbine speed (NP) and main rotor speed (NR) in an arc format and includes the following elements:
Rotor arc scale
NR needle pointer
NP needle pointer
NR digital readout
The rotor arc scale is designed for normal operation and indicates the engine AUTOMATIC governing speed of 104% NR/NP with a magenta NP speed reference pointer (circle) at the 9 o'clock position. The upper red tick shows the 107% NR power on limit, and the middle red tick indicates the 105% NP power on limit.
The lower red tick at 97% NR reflects the 97% NR power on limit, which allows for consistent color change of NR and NP PSI needle pointers. If the commanded NP signal from the controlling Engine Control Unit (ECU) channel becomes invalid (e.g., signal loss), the reference pointer will be displayed as a white circle at 104%.
The NP and NR indicator pointers match the color of the corresponding arc segment. In the event of an actual engine out condition during flight, the NP indicator pointer is shown in grey. If the system detects an invalid NP and/or NR value, the associated pointer will be hidden from view.
During autorotation, the rotor arc is scaled accordingly. The NP speed reference pointer turns white and indicates 104% NR at the 9 o'clock position. The upper red tick represents the 111% NR power off limit, and the lower red tick indicates the 90% NR power off minimum limit.
The NR digital readout is placed within the dual-tach arc and enclosed in a white bordered box with a white NR symbol above it. The digital readout's color corresponds to the color of the NR needle on the arc: green for normal operations, white on red background for red needle conditions, and black on yellow background for yellow needle conditions.
The engine power turbine (NP) indication on the Power Situation Indicator (PSI) is represented by an NP needle pointer; however, there is no digital readout for NP speed.
The NP parameter input to the Dual Tachometer section is provided by the Engine Control Unit (ECU) channel in control (either channel A or B) through its ARINC-429 bus connection. In case the ECU channel in control is not available, the displays will receive data from the other ECU channel, either directly from the ECU or through the Integrated Avionics Unit (GIA). If the ECU channel A or B NP signal to the Integrated Avionics System (IAS) is lost, this will display the ECU DATA or ECU MAINT CAS message.
NP exceedance monitoring is exclusively performed by ECU channel A. Consequently, exceedance annunciation and recording solely rely on data from ECU channel A. The IAS will record exceedances based on data from ECU channel A. A summary of the exceedances will be displayed on the "Aux - Exceedances" page of the MFD, providing a date/time stamp, parameter, peak value, and duration of each occurrence. The exceedance information will remain on the "Aux - Exceedances" page as long as it remains in the Non-Volatile Memory (NVM). Exceedance information can also be referenced on the Aux - OEM Diagnostics > Supplier Systems > ECU - Maintenance pages and in the Maintenance Logs - Exceedances folder.
After an NP exceedance, the ECU MAINT CAS message will be displayed, indicating that maintenance action is required.
The main rotor (NR) indication is located within the dual tachometer section of the Power Situation Indicator (PSI). The NR digital readout shows NR speed as a percentage of the rated RPM.
The NR parameter indication inputs to the Dual Tachometer section is provided by the Integrated Avionics Unit (GIA) via a High-Speed Data Bus (HSDB).
It's important to note that NR exceedances are not recorded by the Integrated Avionics System (IAS).
The Engine Indication System (EIS) strip is responsible for displaying crucial information related to the engine, transmission, electrical, and fuel systems on the Multi-Function Display (MFD) during normal operation.
The engine oil pressure and temperature indications are displayed using vertical scales with an accompanying digital readout. On the left side, engine oil pressure is displayed in PSI, while on the right side, engine oil temperature is shown in degrees Celsius (°C).
Each vertical scale is represented by a white, unfilled rectangle with a pointer bar extending from the base to indicate the parameter value. The top of the pointer bar is trapezoidal, with its flat top pointing to the parameter value. The color of the pointer bar is determined by the parameter's relation to specified operating limits: green, yellow, red, or gray. When the pointer bar is pegged at the bottom of the scale, it remains visible, but it's suppressed when the parameter data is missing or invalid. Thin horizontal reference lines coincide with the limitations for the parameter, and during normal operation, the pointer bar should be within this range.
Additionally, a digital readout is provided at the bottom of each vertical scale, matching the color of the pointer bar. For instance, a green pointer bar is accompanied by a green digital readout. In the event of a yellow or red indication, the corresponding pressure or temperature symbol will also turn yellow or red as applicable. These engine oil temperature and pressure indications are also available as digital readouts on the condensed EIS strip in reversionary mode.
During indications with a green pointer bar, the corresponding pressure “P” and temperature “T” symbols will be displayed in white. Should the pointer bar turn yellow or red, the corresponding pressure “P” or temperature “T” symbol will also turn yellow or red as applicable.
It's important to note that the engine oil pressure and temperature parameter inputs to the Primary Flight Display (PFD) and Multi Function Display (MFD) are provided by the Engine Control Unit (ECU) channel in control, with channel A and channel B alternating control for each flight. If the channel in control signal is lost, the displays will receive data from the other ECU channel or the Integrated Avionics Unit (GIA). In case of signal loss, the display will show the ECU DATA or ECU MAINT CAS message, prompting maintenance action.
The transmission oil pressure and temperature indications are displayed using vertical scales with an accompanying digital readout. On the left side, transmission oil pressure is displayed in PSI, while on the right side, transmission oil temperature is shown in degrees Celsius (°C).
Each vertical scale is represented by a white, unfilled rectangle with a pointer bar extending from the base to indicate the parameter value. The top of the pointer bar is trapezoidal, with its flat top pointing to the parameter value. The color of the pointer bar is determined by the parameter's relation to specified operating limits: green, yellow, red, or gray. When the pointer bar is pegged at the bottom of the scale, it remains visible, but it's suppressed when the parameter data is missing or invalid. Thin horizontal reference lines coincide with the limitations for the parameter, and during normal operation, the pointer bar should be within this range.
Additionally, a digital readout is provided at the bottom of each vertical scale, matching the color of the pointer bar. For instance, a green pointer bar is accompanied by a green digital readout. In the event of a yellow or red indication, the corresponding pressure or temperature symbol will also turn yellow or red as applicable. These transmission oil temperature and pressure indications are also available as digital readouts on the condensed EIS strip in reversionary mode.
During indications with a green pointer bar, the corresponding pressure “P” and temperature “T” symbols will be displayed in white. Should the pointer bar turn yellow or red, the corresponding pressure “P” or temperature “T” symbol will also turn yellow or red as applicable.
The Primary Flight Display (PFD) and Multi Function Display (MFD) receive the transmission oil parameter information through separate High-Speed Data Bus (HSDB) connections from the Integrated Avionics Unit (GIA) Additionally, the PFD and MFD communicate and share data through the cross-communication HSDB.
The amperage indication is displayed as a digital readout. When the amperage is within the allowable operating limits, the digital readout is shown in green. However, if the amperage exceeds the operating limits, the digital readout displays white numbers on a red background. The digital readout is suppressed when the parameter data is missing or invalid. The resolution of the readout is in increments of five amps.
In the green operating zone, the corresponding amperage symbol "A" is displayed in white. If the digital readout is shown as white numbers on a red background, the amperage symbol "A" will turn red as well.
The Primary Flight Display (PFD) and Multi Function Display (MFD) receive the amperage information via separate High-Speed Data Bus (HSDB) connections from the Integrated Avionics unit (GIA). Additionally, the PFD and MFD communicate and share data through the cross-communication HSDB, ensuring accurate information is available to the flight crew.
The amperage indication is also available as a digital readout on the condensed EIS strip in reversionary mode.
Please note that the amperage indication does not provide a current value during engine start.
The voltage indication is displayed as a digital readout. When the voltage is within the allowable operating limits, the digital readout is shown in green. However, if the voltage exceeds the normal operating limits, it is displayed as either white numbers on a red background or black numbers on a yellow background. The digital readout is suppressed when the parameter data is missing or invalid. The resolution of the readout is in 0.1 volt increments.
When the voltage indication is within the green operating zone, the corresponding voltage symbol "V" is displayed in white. If the digital readout changes to black numbers on a yellow background, the voltage symbol "V" will turn yellow. Similarly, if the digital readout changes to white numbers on a red background, the voltage symbol "V" will turn red.
The Primary Flight Display (PFD) and Multi Function Display (MFD) receive the voltage information via separate High-Speed Data Bus (HSDB) connections from the Integrated Avionics Unit (GIA). Additionally, the PFD and MFD communicate and share data through the cross-communication HSDB.
The voltage indication is also available as a digital readout on the condensed EIS strip in reversionary mode.
The fuel quantity indication is presented using a vertical scale with an accompanying digital readout, displaying the usable fuel weight in pounds with a resolution of five-pound increments.
The vertical scale is represented by a cyan, unfilled rectangle. A varying height indicator bar within the vertical scale extends from the base to indicate the fuel quantity value. The flat top of the indicator bar indicates the current fuel quantity. The indicator bar is displayed in cyan color for normal fuel conditions, but when the fuel level reaches low levels (75 ± 10 pounds or less), the indicator bar changes to yellow.
Thin horizontal reference lines are provided to indicate half tank and full tank reference points.
The digital readout associated with the fuel quantity is displayed above the vertical bar as a cyan digital readout within a white, unfilled rectangular field, except during low fuel conditions. When the fuel level is low, the readout is displayed as black digits within a yellow filled rectangle.
If the fuel quantity data is missing or invalid, the display of the indicator bar is suppressed, and a red X appears across the bar scale along with the associated digital readout.
During indications within the cyan operating zone, the corresponding fuel quantity symbol "TOT LBS" will be displayed in cyan. If the digital readout is displayed as black numbers on a yellow background due to low fuel levels, the corresponding fuel quantity symbol "TOT LBS" will turn yellow.
Both the Primary Flight Display (PFD) and Multi Function Display (MFD) receive the fuel quantity information via separate High-Speed Data Bus (HSDB) connections from the Integrated Avionics Unity (GIA). Additionally, the PFD and MFD communicate and share data through the cross-communication HSDB.
The fuel quantity indication is also available as a digital readout on the condensed EIS strip in reversionary mode.
The fuel flow indication is presented in Pounds Per Hour (PPH) through a digital readout, with a resolution of 10 PPH increments.
The digital readout associated with the fuel flow indication is displayed in cyan color within a white, unfilled rectangular field. However, if the fuel flow data is missing or invalid, a red X appears across the digital readout, indicating that the information is not available or accurate.
To calculate the fuel flow value, the Engine Control Unit (ECU) uses the position of the fuel metering needle, along with fuel density and fuel temperature. The ECU calculates the fuel flow in kilograms per hour (kg/h), and this value is then converted into PPH by the GIA.
Both the Primary Flight Display (PFD) and Multi Function Display (MFD) receive the fuel flow information via separate High-Speed Data Bus (HSDB) connections from the Integrated Avionics Unit (GIA). Additionally, the PFD and MFD communicate and share data through the cross-communication HSDB.
The fuel flow indication is also available as a digital readout on the condensed EIS strip in reversionary mode.
However, it's important to note that during engine operation in Auxiliary Control Unit (ACU) backup mode, and if the main fuel metering needle is frozen, the fuel flow indication on the EIS should be considered unreliable. In such cases, the crew should exercise caution and rely on other available fuel-related information or systems to monitor the fuel flow.
To assist with maintenance and troubleshooting requirements, the Multi-Function Display (MFD), provides four sources of diagnostic and maintenance data information as follows:
OEM Diagnostics - Bell Maintenance Pages
Maintenance Logs
Maintenance SD Card
Exceedances Page
To access and view the OEM Diagnostics - Bell Maintenance pages on the Multi-Function Display (MFD), a Maintenance SD card must be installed into the upper SD card slot of the MFD and the helicopter must be on the ground with the WOG Crew Alerting System (CAS) message displayed.
The OEM Diagnostics - Bell Maintenance pages provide various main menu options including:
Live Data View
Fault History
Power Assurance Check (PAC)
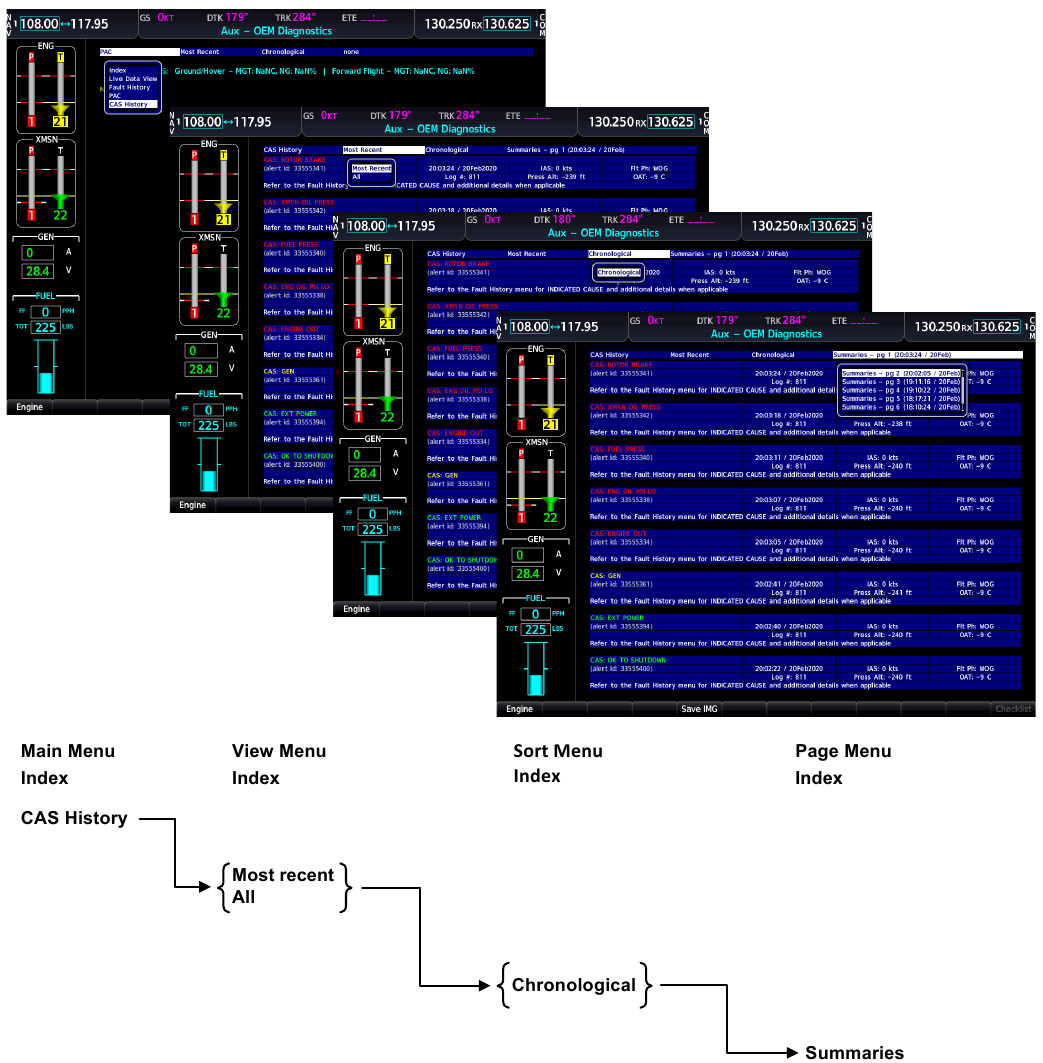
CAS History
Parameter data in the form of values (i.e., percent, deg C, kPa, etc.), or in the form of parameter status information (Ok/True/False/ Unknown), is provided on the various viewing pages. The information is accessed and displayed on the Multi-Function Display (MFD). The data contained within the various Bell Maintenance pages is provided to assist with maintenance and troubleshooting requirements.
Individual Bell Maintenance pages can be saved to the Maintenance SD card “print” folder by using the “Save IMG” softkey. If the MFD page you would like to save does not have a Save IMG softkey, you may press the No. 2 and No. 9 softkeys at the same time for approximately two seconds. This saves a bitmap (.bmp) file of the current screen image to the “print” folder on the Maintenance SD card.
To assist in understanding the information being displayed, an explanation of the displayed information is provided in yellow text on each OEM Diagnostics - Bell Maintenance page.
The highest-level structure of the OEM Diagnostics - Bell Maintenance pages, provides the following Main Menu page selections:
Live Data View
Fault History
PAC (Power Assurance Check)
CAS History (Crew Alerting System)
Each of the Main Menu selections have multiple View Menu options.
The Live Data View selection provides status information on the following View Menu categories:
Supplier Systems
Engine/ECU parameter, status, discrete, failure, maintenance, over limit/exceedance and inconsistency information applicable to ECU CH A and ECU CH B.
Engine and Airframe Interface Unit (GEA) Discrete and Analog information
Integrated avionics unit (GIA) Discrete information
Garmin LRU Status provides a current status of each of the Garmin Line Replaceable Units (LRU) as well as a Prod status
Garmin Port Status provides a current port status of the PFD and MFD as well as the integrated avionics unit (GIA)
The Fault History page provides indicated cause as well as details of the Crew Alerting System (CAS) messages recorded by the indicating and recording system system. The initial page displayed is a summary page of the most recent Faults which have been recorded. Additional summary pages are also provided based on the number of Faults recorded.
The Faults History page is also associated with the information provided on the CAS History pages.
The PAC (Power Assurance Check) page provides a historical record of the power assurance checks performed by the indicating and recording system. The page displayed is a summary page of the most recent power assurance checks which have been recorded.
The CAS (Crew Alerting System) History page provides a historical record of the CAS messages recorded by the indicating and recording system. The initial page displayed is a summary page of the most recent CAS messages which have been recorded. Additional summary pages are also provided based on the number of CAS messages recorded.
In addition to the CAS History information provided on the Bell Maintenance Pages, details are also provided within the Maintenance Logs.
To obtain information on the indicated cause as well as details of the recorded CAS messages, reference to the Fault History Bell Maintenance Page may also be carried out.
The Maintenance Logs feature allows the pilot and maintenance crews to view event fault monitoring and logged data on the aircraft. Any log displayed can be selected for viewing. The selected log and its contents are displayed on the Multi-Function Display (MFD). This includes information from the header along with fault events and associated parameters.
The system records Exceedances, Faults, Power Assurance Checks, five Hz Logs, CAS History and Garmin Alerts. With the exception of the 5 Hz Log folder, which continuously records multiple engine Engine Control Unit (ECU) parameters for each flight at intervals of five times per second, the remaining folders record data for each flight as specific exceedance, fault, power assurance, Crew Alerting System (CAS), or Garmin Alert events occur. The information is recorded in the applicable folders as comma-separated values (.csv) files. The functionality for acquisition, event/fault monitoring, logging, storage, viewing, and exporting data is resident on the MFD and the PFD. Data is retained in the system when the MFD is not powered on. Each display unit in the system will generate a separate, independent data log file.
Exporting logs over multiple means (e.g., SD card, optional Iridium Transceiver) is available for any log. In practice, PFD logging will be a backup repository and will only be utilized in the event the MFD is not powered. There is no synchronization process for the logs across display units and all log file synchronization will be performed as a post processing step once the data is off the aircraft.
The data can be viewed from the MFD through the Aux - Maintenance Logs Page. The base page displays the following folders:
Exceedances, records Exceedance Data parameters associated with CAS message activations for each flight
Faults, records Fault Data parameters associated with CAS message activations for each flight
Power Assurance Checks (PAC), records PAC parameter values and ECU calculated results for each power assurance check performed by the indicating and recording system
5 Hz Log, records engine FADEC parameters for each flight at 5 second intervals
CAS History, records CAS message activations and associated information for each flight
Garmin Alerts, records Garmin Alert activations for each flight
Inside a folder you can view each log. Inside a log you are able to view the event entries that were recorded, and the trigger value of every event entry can be viewed by pressing the Details Softkey. Details of the trigger value can be viewed by pressing the Data Softkey. Some of the data within the Maintenance Log folders is not viewable on the MFD, it first needs to be copied to the MFD Maintenance SD Card using the “Export” feature on the applicable folder page. The information is provided to assist with maintenance and troubleshooting requirements.
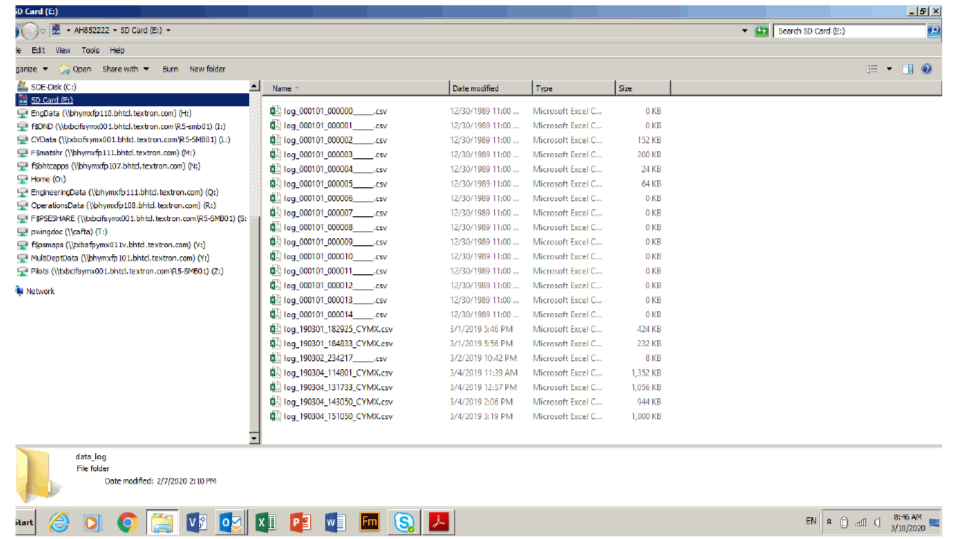
The Maintenance SD Card contains individual folders pertaining to, five Hz Logs, CAS History, data_log, Exceedances, Faults, Garmin Alerts, Power Assurance Checks, and Print. With the exception of the data_log folder, which continuously records multiple Garmin Integrated Avionics System (IAS) parameters for each flight at one second intervals (i.e. one Hz), the remaining folders provide a means to transfer (i.e. Export), the data residing in the Maintenance Log folders, and to capture screen shot images of any MFD displayed page. Screen shot images of the various MFD pages will be captured in the “print” folder. Although the data contained within the Maintenance SD Card is not directly viewable on the MFD, the SD card can be removed and inserted into a Windows compatible PC or laptop, incorporating an appropriate SD card reader, to view, save, print, e-mail or delete the data from the applicable folder as required.
Although exceedance and fault information for the engine is provided within the available MFD diagnostic and maintenance data, please refer to the Engines Maintenance Manual for specific information on the usage of diagnostic and maintenance data stored within the FADEC ECU.
As a primary means to quickly view exceedance data, the Exceedances page should be used.
The Flight Data Logging feature will automatically store critical flight and engine data on an SD data card (up to 16GB) inserted into the top card slot of the MFD. Approximately 1,000 flight hours can be recorded for each 1GB of available space on the card.
Data is written to the SD card once each second while the MFD is powered on. All flight data logged on a specific date is stored in a file named in a format which includes the date, time, and nearest airport identifier. The file is created automatically each time the system is powered on, provided an SD card has been inserted.
The status of the Flight Data Logging feature can be viewed on the Aux - Utility Page. If no SD card has been inserted, NO CARD is displayed. When data is being written to the SD card, LOGGING DATA is displayed. The .csv file may be viewed with Microsoft Excel® or other spreadsheet applications.
The Maintenance SD card must be installed into the upper SD card slot of the MFD for the data logs to be recorded.
Individual files continue to be saved and stored in the data_log folder, for each flight until such time that the Maintenance SD card is full. The information is provided to assist with maintenance and troubleshooting requirements.
DO NOT DELETE THE DATA_LOG FOLDER FROM THE MAINTENANCE SD CARD. THIS FOLDER IS REQUIRED IN ORDER FOR THE SYSTEM TO AUTOMATICALLY SAVE THE FLIGHT DATA INFORMATION FILES.
To ensure the Maintenance SD card maintains adequate space for continuous recording and storage of the data_log files, it is recommended that the files be copied from the data_log folder at least once a year or every 1000 hours of flight operation. Once the files are copied and stored in another location for possible future reference, the existing files can be deleted from the data_log folder.